Yarmouth Greyhound Results Today: Where to Find Them and What to Look For
I have lost count of the number of times I have sat down on a Monday evening, pulled up the Yarmouth results page and found myself staring at a wall of numbers with no idea where to start. It took me a few years of doing this three or four nights a week before the data stopped looking like noise and started telling a story. Yarmouth runs meetings every Monday, Wednesday and Sunday morning, with occasional Saturday evening cards thrown in, which means there is a constant stream of fresh data to process if you know where to look.
The problem most punters face is not a shortage of results – it is working out which source to trust, which columns actually matter and how to extract a usable edge from a single card. This guide is built around the specific patterns that Yarmouth throws up on any given race night, and the practical habits I have developed over more than a decade of tracking this particular venue.
With BAGS alone producing over 25,000 races annually across the licensed circuit, Yarmouth contributes a significant chunk of that total. Every meeting generates data that disappears from most punters’ attention within hours. The ones who profit are the ones who know how to catch it before it fades.
See also: yarmouth dogs results for the latest results updated daily.
Where Yarmouth Results Are Published
Ten years ago, getting hold of same-day greyhound results meant waiting for the Racing Post to land on your doormat or catching a late-night teletext update. The landscape now is completely different, but it brings its own problems – there are so many sources that beginners often bounce between three or four sites without settling on one they trust.
The official Yarmouth Stadium website publishes PDF advance cards and results, but these are static documents that require you to download and open each file individually. Useful for archiving, less useful for quick reference. The major racing data platforms – Timeform, At The Races, and the various aggregator sites – all carry Yarmouth results within minutes of each race finishing. Timeform adds its own ratings and Betfair Starting Price data, which gives you an extra analytical layer, though the deeper data sits behind a paywall.
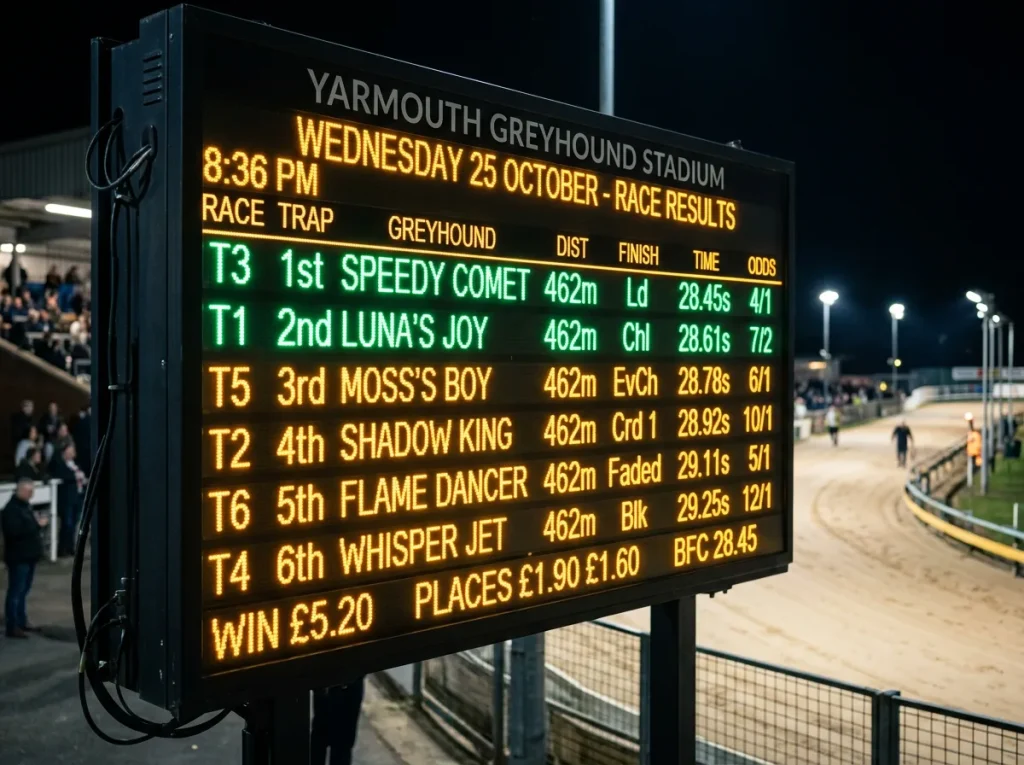
For pure speed, the free aggregators are hard to beat. They pull results from the BAGS feed almost in real time, and most present the data in a consistent table format: trap, dog name, finishing position, distance behind the winner, winning time, starting price. The BAGS feed itself is the backbone of every results page you will ever see for a Yarmouth weekday meeting – all these sites are drawing from the same pipe, so the numbers are identical. What differs is the presentation and the extras layered on top.
My own routine is simple. I check one primary aggregator for the raw results within half an hour of the last race, then cross-reference with Timeform the following morning for ratings adjustments. Trying to do everything in one sitting the same evening usually leads to rushed conclusions.
What to Look For in Tonight’s Results
Here is a habit that changed the way I read results entirely: stop looking at the winner first. I know that sounds counterintuitive, but the winner’s story is usually the least interesting part of the result. The dog that finished third after being bumped at the second bend, or the one that ran wide from trap six and still clocked a fast sectional – those are the stories that pay out next week.
Start with the winning time and compare it to the standard for that grade and distance. Yarmouth runs four distances – 277, 462, 659 and 843 metres – and each has its own range of expected times depending on the grade band. A 462m A5 race finishing in 28.90 seconds tells a very different story from the same distance finishing in 29.40. The first suggests fast going and genuine pace in the field; the second suggests either soft conditions or a tactical race where the leader dawdled.
Next, look at the distances between finishers. A result reading 1st, 2nd by a neck, 3rd by three lengths is a compressed finish where the placed dogs ran close to their ability. A result where the winner is six lengths clear tells you either the winner was thrown in at the grade or the rest of the field had problems. Both scenarios create value for the next meeting, but in opposite directions.
Finally, check the comments column if your source provides one. Phrases like “slow away”, “crowded first bend” and “ran on” are compressed race narratives that explain why the finishing positions look the way they do. I keep a simple spreadsheet where I log any dog that had a troubled run. When that dog reappears on the next Yarmouth card, I already know the form figure does not reflect true ability.
Spotting Patterns From a Single Card
A few years back, I started a quiet experiment. Instead of looking at results race by race, I pulled back and looked at the entire card as one data set. Which traps won the most races that night? Were the winning times faster or slower than the previous meeting on the same day? Did early-pace dogs dominate, or were closers getting up late?
This card-level analysis sounds academic, but it produces surprisingly actionable insights. If trap one wins four out of twelve races on a Monday card, and the previous Monday it won three out of twelve, you are starting to see a rail bias pattern that might persist into Wednesday. Track conditions at Yarmouth – a coastal venue exposed to North Sea wind – can shift between meetings, and those shifts show up in the aggregate trap results before they show up in any individual race.
Nationally, trap one carries a win rate of roughly 18-19% against a theoretical expectation of 16.6% for a six-runner field. But that national figure masks significant track-by-track variation, and a single Yarmouth card can tell you whether the venue is running true to form or whether conditions are pushing the bias in an unusual direction. Favourites across the UK win around 35.67% of graded races, but the range stretches from under 32% at some venues to over 42% at others. Tracking where Yarmouth falls on any given night is the first step to understanding whether the market is pricing dogs correctly.
The practical takeaway is this: never treat tonight’s results as twelve isolated events. Treat them as one snapshot of how the track is behaving right now. When you sit down to study the racecard for the next meeting, that snapshot should be your baseline.
If you want to go deeper into interpreting those racecard columns before the results even come in, I have written a full breakdown of how to analyse Yarmouth results and form data that covers the entire process from card to post-race review.
See also: Yarmouth Greyhound Racecard to deepen your understanding.