
Greyhound Racing Results Archive for Yarmouth: Where to Find Historical Data
 Available in US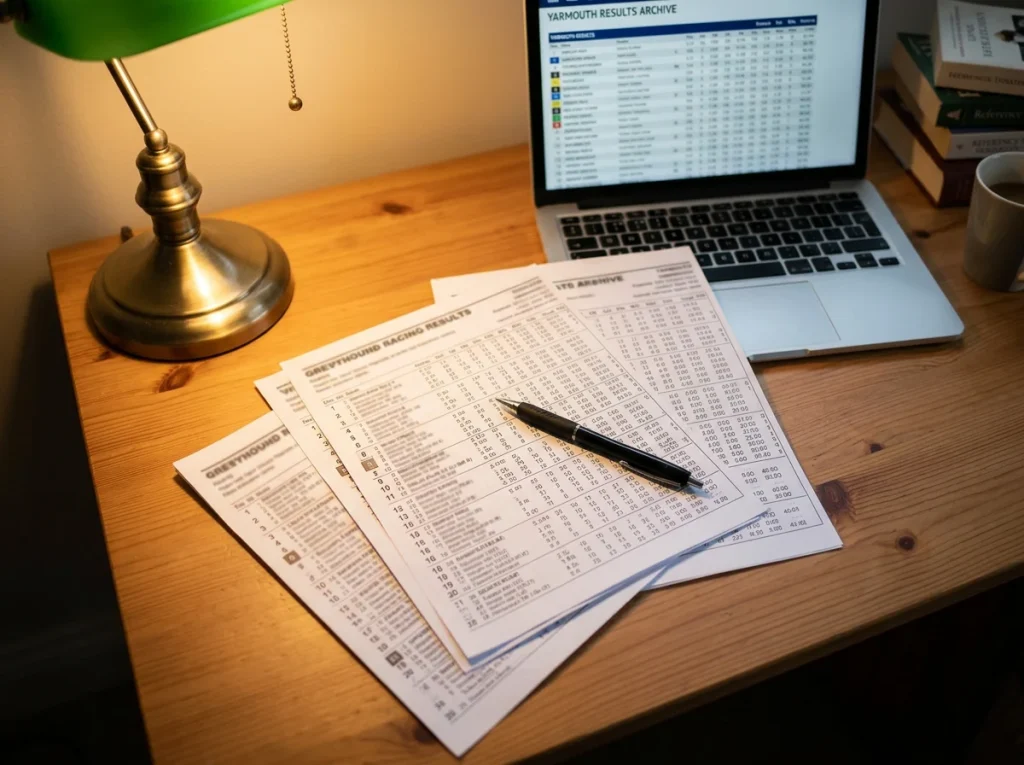
I started building my Yarmouth results archive in a single spreadsheet in 2015. Eleven years later, that spreadsheet has grown into a database with thousands of races, and it remains the single most valuable resource I own as a greyhound analyst. The reason is simple: greyhound form is cumulative. A dog’s result today means more when you can compare it to results from the same grade, the same distance and the same trap position over months or years. The punters who work from tonight’s card alone are competing against the punters who work from the entire history of the track, and the history wins.
The good news is that you do not need to build your own archive from scratch. Historical Yarmouth results are available from several sources, and understanding where the data lives, how far back it goes and what limitations it carries is the first step to using it productively. The 18 licensed stadiums across Britain produce over 70,000 races a year, and the archived data from Yarmouth alone represents a substantial analytical resource.
See also: yarmouth dogs results and browse the full results archive.
Where Yarmouth Historical Results Are Stored
The primary sources for archived Yarmouth results fall into three categories. The first is the official Yarmouth Stadium website, which publishes results as PDF documents after each meeting. These PDFs are useful for the most recent meetings but are not structured for easy searching – you need to know the date of the meeting you want and download each file individually. For building a long-term database, the PDF approach is labour-intensive.
The second category is the major data aggregator sites. Platforms like Timeform, At The Races and the various free results sites that pull data from the BAGS feed carry Yarmouth results going back months or, in some cases, years. These platforms typically offer searchable interfaces where you can filter by track, date, distance and grade, which makes trend analysis significantly easier than working through individual PDFs. The depth of the archive varies by platform – some retain results for twelve months, others go further back.
The third category is specialist greyhound data services. These are the platforms used by serious form analysts and professional punters, and they offer the deepest historical archives with the most comprehensive data fields – including sectional times, calculated splits, trainer statistics and trap bias breakdowns that the free sites do not provide. Access typically comes with a subscription fee, but for anyone building a systematic approach to Yarmouth, the investment pays for itself quickly in analytical depth.
Racing on Mondays, Wednesdays and Sundays with periodic Saturday evening cards, Yarmouth produces a significant volume of data across each month. The more comprehensively you archive that data, the richer your analytical foundation becomes.
How to Use Archived Data for Trend Analysis
Archived results are not just records of what happened – they are tools for predicting what will happen. The key is knowing which trends to extract and how to apply them to future meetings.
Trap bias trends are the most obvious application. By aggregating trap one win rates at Yarmouth over the last six months and comparing them to the previous six months, you can identify whether the track’s bias is stable, shifting or seasonal. A rail advantage that strengthens in winter – when the going is heavier and the inside line offers more protection from the elements – and weakens in summer is a seasonal pattern that historical data reveals but no single night’s results can show.
Grade-level performance trends are equally valuable. If A5 race winning times at Yarmouth have been gradually getting faster over the past three months, that tells you the current A5 population is stronger than the A5 population from a quarter ago – perhaps because a batch of recently upgraded dogs is faster than the ones they replaced. This kind of trend is invisible on tonight’s racecard but clearly visible in the archive.
Trainer performance trends round out the picture. A kennel whose win rate at Yarmouth has jumped from 15% to 22% over the past two months is in a hot streak, and identifying that streak from the archive allows you to weight that trainer’s runners more favourably before the market catches up. Favourites win around 35.67% of graded races nationally, but individual trainer form runs in cycles, and the archive is how you spot which cycle a kennel is in.
Limitations of Archived Greyhound Data
No data source is perfect, and greyhound archives have specific limitations that you need to understand before relying on them.
The most significant limitation is the absence of going data. Unlike horse racing, where the going report is recorded and archived alongside every result, greyhound results do not carry an official going description. This means that times in the archive are raw – unadjusted for surface conditions, weather and wind. A time of 29.00 recorded in July on fast going is filed alongside a time of 29.00 recorded in January on heavy going, and the archive does not distinguish between them. The adjustment has to come from you, which is why I maintain my own going estimates alongside the raw results.
The second limitation is data completeness. Free aggregator sites may carry the finishing positions and winning times but omit the race comments, the sectional data and the weight information that paid services include. An analysis based on incomplete data will produce incomplete conclusions – so knowing what is missing from your source is as important as knowing what is present.
The third limitation is population turnover. Greyhound racing careers are short – most dogs race for two to three years before retirement. The population of dogs at Yarmouth turns over substantially every year, which means trends extracted from data older than twelve months may reflect a population of dogs that no longer exists. The trap bias and track geometry are stable, but the kennel patterns and grade standards shift with the dog population. I weight recent data more heavily than older data for exactly this reason, and I use the archive primarily for structural trends – trap bias, going effects, seasonal patterns – rather than for individual dog analysis beyond the current form window.
Building and maintaining a Yarmouth archive is one of the foundational habits of serious form analysis, and it integrates directly with every other element of the analytical approach I use for this track.
See also: Yarmouth Dogs Results Page with additional insights and data.
